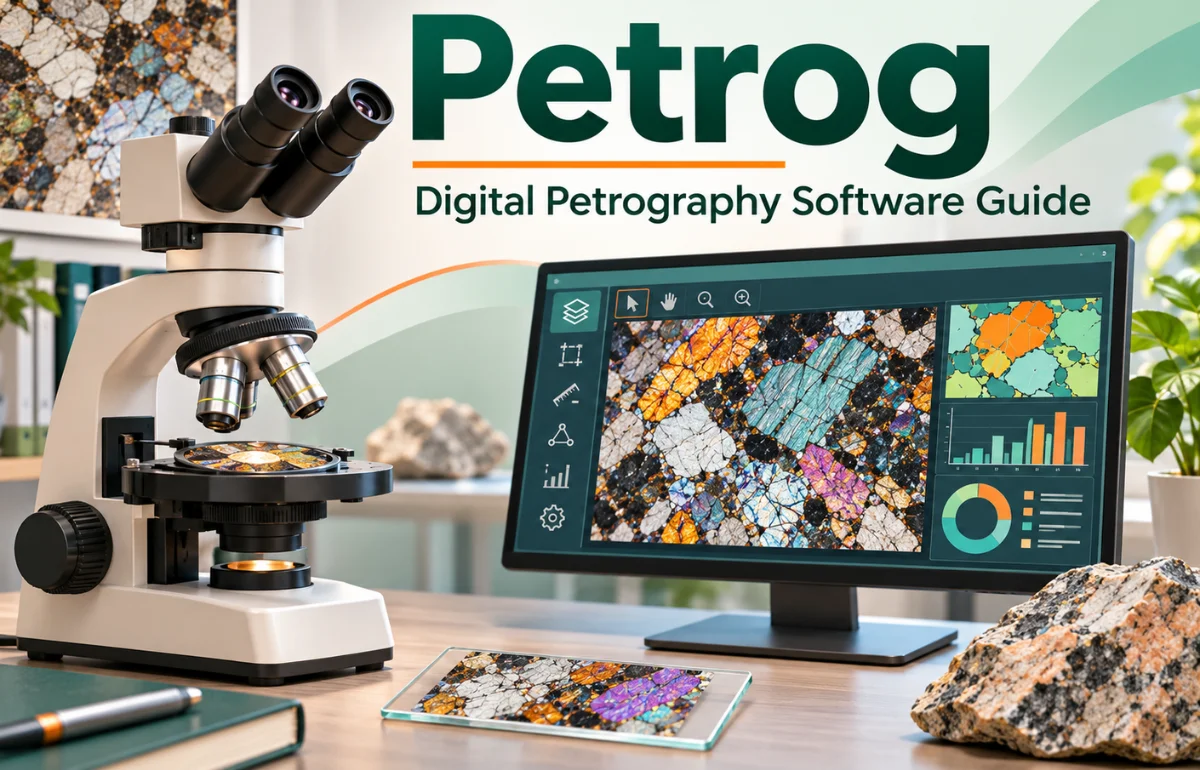
Petrog can mean two related things. In dictionaries, “petrog.” is an abbreviation for petrography, the branch of geology that describes and classifies rocks. In scientific software, PETROG is a digital petrography system developed by the UK company Conwy Valley Systems Limited.
It helps specialists examine rock thin sections and polished samples, record mineral observations, count microscopic points, manage images, and turn those observations into structured reports.
Rather than replacing a geologist’s judgment, the system organizes the work around a microscope and makes findings easier to revisit and compare.
This article focuses on the PETROG software, while explaining the underlying science and the practical questions a laboratory should ask before adopting it.
What Does Petrog Mean?
The distinction matters because the same search term can lead to very different answers. Someone encountering “petrog.” in a glossary may simply need the meaning of petrography. Someone researching microscope software is probably looking for the PETROG product, its features, compatibility, or cost.
As Collins English Dictionary confirms, the abbreviation refers to the scientific field, not to a specific product.
Petrography itself is not a software brand. It is the close study of rocks, commonly through microscopic examination of thin sections. A petrographer may identify minerals, describe grain shapes, estimate proportions, and look for clues about a rock’s formation or later alteration.
PETROG, by contrast, is a named tool built for this professional workflow. Conwy Valley Systems developed the software to connect data collection, microscope positioning, image records, and analysis in one environment.
I find it useful to think of petrography as the discipline and PETROG as one specialized way of managing its evidence.
Why Digital Petrography Matters
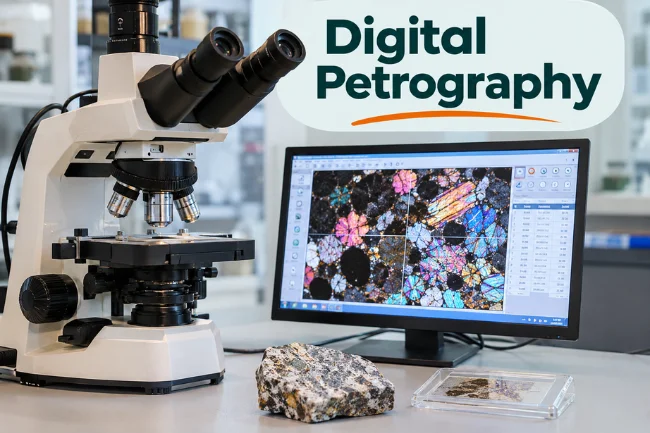
Under a polarizing microscope, a rock slice tells a story that a photograph of the entire rock cannot. Quartz, feldspar, pores, cement, fractures, and other features may become distinguishable.
A trained observer interprets what appears at each location and records the result.
Traditional workflows can involve a mechanical slide stage, a point counter, handwritten notes, separate photographs, and spreadsheets. Those tools still work.
The difficulty arises later: Which exact grain was counted? Was the same mineral named consistently across analysts? Can another researcher check an unexpected result without starting over?
Digital petrography addresses those questions by connecting observations with positions, images, sample identifiers, and agreed classification terms.
The Federal Highway Administration’s microscopy guidance also explains the underlying grid-based point-counting method.
The benefit is not merely speed. It is a clearer chain between the material examined and the interpretation eventually published or used in an engineering decision.
How Does PETROG Work in a Laboratory?
1. Prepare and Identify the Specimen
The process begins with a properly prepared thin section or polished block. The sample must be representative of the material under investigation, because even the most sophisticated software cannot correct a biased specimen.
A petrographer assigns sample details and chooses the microscopy method appropriate to the question.
Thin sections are commonly examined in transmitted light. Polished blocks can be investigated in reflected light. PETROG supports both types of analysis, including microscope-camera images and scanned material.
The exact setup depends on the microscope, camera, and software configuration.
2. Define the Area and Counting Plan
For quantitative work, the operator selects an area of interest and a point-counting strategy.
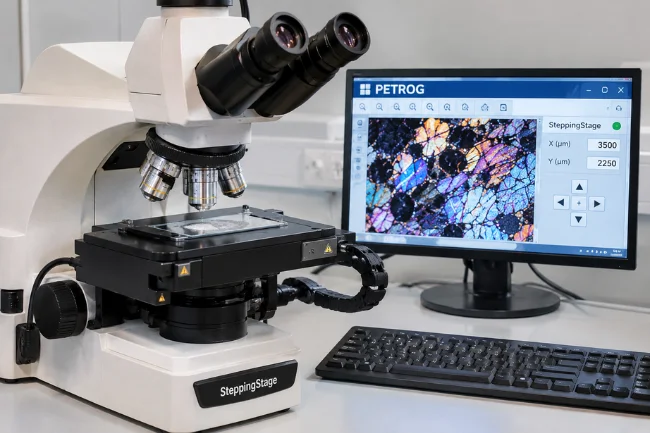
PETROG’s digitally controlled SteppingStage then moves the specimen to specified positions. This helps distribute observations systematically rather than concentrating on whichever grains catch the eye.
Point spacing, target count, magnification, and how empty or unusable positions are handled all affect the result.
I would document those decisions before collecting data, especially when different teams may compare their results months later.
3. Identify Features and Record Observations
At each position, the trained analyst identifies the material beneath the microscope crosshair and records the appropriate category.
The software can use structured classification lists and additional qualifiers, allowing observations to capture more than a single mineral name.
A camera can place the microscopic view alongside the data-entry interface. That gives the observer immediate visual context while keeping the description linked to the sample.
The software supports compositional information, such as what a rock contains, and textural information, such as grain size and shape.
4. Review, Analyze, and Report
Once the measurements are complete, PETROG brings the records together for summaries, charts, editing, and reporting.
Stored positions and associated imagery can support later quality checks. The system also offers tools for reviewing mineral proportions and other relevant measurements.
Consider a hypothetical sandstone sample in which an analyst needs to report quartz, feldspar, and lithic fragments.
The real value is not the final percentages alone. It is being able to trace those figures back to a defined sampling method, recorded observations, and a reviewable specimen.
PETROG Features That Make a Practical Difference
Automated Microscope Positioning
The SteppingStage is a central part of the PETROG ecosystem.
It mounts to a suitable microscope stage and controls specimen movement through software. This reduces the repetitive work of manually positioning each point and helps maintain a repeatable sampling pattern.
Automation here refers to moving and organizing observations, not automatically knowing every mineral.
Human expertise remains essential when minerals are ambiguous, grains overlap, or alteration makes classification difficult.
Integrated Images and Virtual Slides
PETROG can work with live microscope-camera views and scanned images.
It also supports image stitching, which combines overlapping views into a broader visual representation of a slide. This makes it easier to relate a microscopic detail to the surrounding material.
Images can be particularly helpful during independent review, remote collaboration, and teaching.
However, stitched images should still be checked for alignment errors, unusual lighting, or missing areas before they are treated as reliable records.
Structured Data and Classification Rules
A spreadsheet can store counts, but it does not automatically enforce the same vocabulary across a department.
PETROG uses a relational database and organized classification structures to connect samples, observations, and supporting information.
That consistency matters when a laboratory changes staff or revisits an old investigation.
If one analyst writes “quartz” and another uses an unexplained abbreviation, comparisons become unnecessarily difficult. A shared terminology policy makes the resulting dataset more useful.
Analysis, Reports, and Auditability
PETROG includes analytical and reporting tools, including ways to summarize compositional and textural observations and relate data to images.
Its traceability features can help a reviewer understand where a recorded observation came from.
I would still distinguish an auditable record from a scientifically correct conclusion.
A well-organized database helps expose mistakes; it does not prevent poor sampling, misidentification, or unsuitable statistical assumptions.
Where Is PETROG Used?
Oil, Gas, and Sedimentary Geology
In reservoir studies, thin-section petrography helps specialists examine rock framework grains, cement, pores, and alteration.
Those observations can inform interpretation of reservoir quality and geological history.
PETROG helps collect and compare the underlying petrographic evidence, although it does not replace core analysis, well logs, or other geological methods.
Concrete, Cement, and Construction Materials
Concrete investigations may ask whether a material contains unusual constituents, deterioration products, or features relevant to durability.
Polished specimens and thin sections can reveal details that bulk measurements overlook.
Here, consistent point counting and a retrievable image record can be useful for quality assurance and independent review.
Coal, Steel, Ceramics, and Archaeology
The software is also used in areas where microscopic composition and texture affect material evaluation.
Examples include coal analysis, steelmaking inputs, ceramic fabrics, and archaeological building materials.
Although the samples vary widely, the recurring need is the same: record what was observed, where it was observed, and how it was classified.
Universities and Research Laboratories
For teaching, the system can connect a microscope view to a classification exercise and later analysis.
For research, consistent terminology and archived observations support comparisons between samples, projects, and researchers.
Training is still needed; digital tools do not automatically turn a beginner into a petrographer.
PETROG vs. PetrogLite: Which Is Different?
According to the developer’s PetrogLite documentation, Conwy Valley Systems offers PetrogLite as a simpler option built around point counting and SteppingStage control.
It is not merely a smaller screen inside the same full application. Its data-handling capabilities are materially different.
| Capability | PETROG | PetrogLite |
|---|---|---|
| Automated stage control | Yes | Yes |
| Point-count data entry | Yes | Yes |
| Integrated camera display | Yes, with a supported setup | No |
| Relational database | Yes | No; uses spreadsheet-compatible text files |
| Advanced analysis and reporting | Yes | Not the full PETROG toolset |
| Best fit | Detailed, traceable workflows | Basic or focused point-counting tasks |
PetrogLite may suit a department that already has a well-managed reporting process and mainly wants to replace a conventional point counter.
PETROG makes more sense when image-linked evidence, data reuse, and integrated analysis are central requirements.
The company says PetrogLite data can be transferred into the full PETROG environment if a laboratory upgrades.
PETROG vs. Manual Point Counting
Neither option eliminates the need to decide what counts as a mineral or component.
The key difference is how the observation travels from the microscope into a record another person can inspect.
| Question | Manual or basic workflow | PETROG-based workflow |
|---|---|---|
| How is the slide moved? | By hand or a separate mechanism | Controlled SteppingStage |
| Where are observations stored? | Notes, counter totals, or spreadsheets | Linked records in a database |
| Can individual points be revisited? | Depends on manually kept records | Position and image links can help |
| How are reports produced? | Usually assembled across tools | Integrated analysis and reporting options |
| What remains essential? | Analyst judgment and quality control | The same analyst judgment and quality control |
For a handful of routine counts, a simpler approach can be sufficient.
For hundreds of specimens, multiple analysts, or a project requiring defensible traceability, the management overhead of manual records becomes more significant.
What Should a Laboratory Check Before Choosing PETROG?
The purchasing question is not simply, “Does it count points?”
I would begin with the full workflow, including hardware, staff training, file storage, and future data access.
First, verify the exact microscope and camera models. A compatible microscope does not automatically mean every camera and driver combination will work.
Next, confirm the supported Windows version, stage connections, storage needs, and any additional licensing arrangements.
Then request a demonstration using a sample similar to the laboratory’s real material. Try a straightforward specimen and a difficult one.
Ask how the software handles ambiguous categories, interrupted counts, corrections, and exporting results to established reports.
Finally, test whether someone other than the original operator can review the evidence.
If a result is questioned next year, a readable archive may matter more than saving a few seconds during data entry.
The Hidden Issue: Counting More Points Is Not Always Enough
A numerical example makes this clearer.
Suppose a petrographer identifies quartz at 120 of 400 sampled positions. The observed share is 30%.
Under an idealized independent-point model, its approximate sampling standard error is 2.3 percentage points, corresponding to a rough 95% margin of about 4.5 points.
That is an illustration, not a confidence interval automatically supplied by PETROG.
Real rock fabrics can be clustered, and nearby points may not be independent.
A representative sampling plan and suitable compositional statistics are therefore just as important as a large count. Research on point-counting statistics distinguishes counting uncertainty from genuine variation between samples.
My preferred quality-control test would compare repeated counts of the same slide, record disagreements by category, and review skipped points.
This can reveal ambiguous classification rules or preparation problems that an impressive-looking final percentage might hide.
Can PETROG Data Support AI and Machine Learning?
Potentially, yes.
Well-labeled petrographic records can become useful training or validation material for image-analysis research.
PETROG supports structured data, archived images, and workflows for reusing older observations. Those are helpful foundations for machine learning.
But “AI-ready” is not the same as “AI-verified.”
Models can inherit inconsistent labels, biased sample selection, and imaging artifacts.
Before using an archive for automated classification, I would check that every record has a specimen identifier, imaging method, classification version, and review status.
A useful additional practice is to preserve difficult or disputed examples rather than removing them.
Those cases show where expert interpretation is uncertain and where a future model most needs careful evaluation.
This is a data-governance recommendation, not a claim that PETROG automatically performs such validation.
PETROG Versions, Compatibility, and Pricing
As of 2026, the manufacturer lists PETROG 6 and PetrogLite 6, with PETROG 6.0.5 announced on its official news page.
Its version-6 documentation identifies Windows 11 as the fully verified operating system and explains that existing customers need the appropriate licence key and, when upgrading, database migration.
Published pages for older releases may mention Windows 10, so I would check the documentation for the exact version being installed rather than rely on a general search snippet.
Pricing is quotation-based on the manufacturer’s enquiries page; hardware, camera requirements, support, shipping, and local taxes may change the total.
Academic discounts may be available for eligible noncommercial use.
Is PETROG Worth Considering?
For a laboratory that only needs occasional mineral counts, the full system may be more than necessary.
For teams that repeatedly examine thin sections, need consistent terminology, or must explain their results to clients and reviewers, integrated digital petrography can offer a more durable workflow.
I would judge its value against three measurable outcomes: time spent per completed, reviewed specimen; the effort needed to reproduce or audit a result; and how easily archived observations can be reused.
Those measures are more meaningful than a feature list because they reflect the actual work a laboratory performs.
Final Thoughts
Petrog has a simple dictionary meaning, but PETROG the software addresses a specialized and practical problem: how to turn microscope observations into organized, reviewable scientific evidence.
Its strengths are most relevant when repeatability, image context, and long-term data management matter.
If you are considering it, start with your microscope configuration and request a demonstration using your own sample types.
A short, realistic pilot will show whether the complete PETROG system or the lighter PetrogLite approach fits your needs.
Frequently Asked Questions About Petrog
What is Petrog used for?
PETROG is used to record and analyze microscopic observations of rocks and other materials, especially through digital point counting, image management, and petrographic reporting.
Is Petrog the same as petrography?
No. “Petrog.” can abbreviate petrography, the scientific discipline; PETROG is also the name of a specific digital petrography software system.
Is PETROG free software?
PETROG is a commercial product. The developer provides purchasing enquiries and licence-based downloads rather than advertising it as a free, unrestricted application.
What is the difference between PETROG and PetrogLite?
Both support the automated SteppingStage, but PetrogLite focuses on basic point counting while PETROG adds integrated imaging, database management, analysis, and reporting.
Does PETROG work on Windows 11?
Yes. The manufacturer says PETROG 6 is fully verified for Windows 11; users should also confirm their microscope camera and other hardware are supported.

Noah Sterling is a technology research writer with 8+ years of experience covering emerging technologies, software trends, digital tools, and innovation. He creates practical, research-based articles to help readers understand the evolving technology landscape.