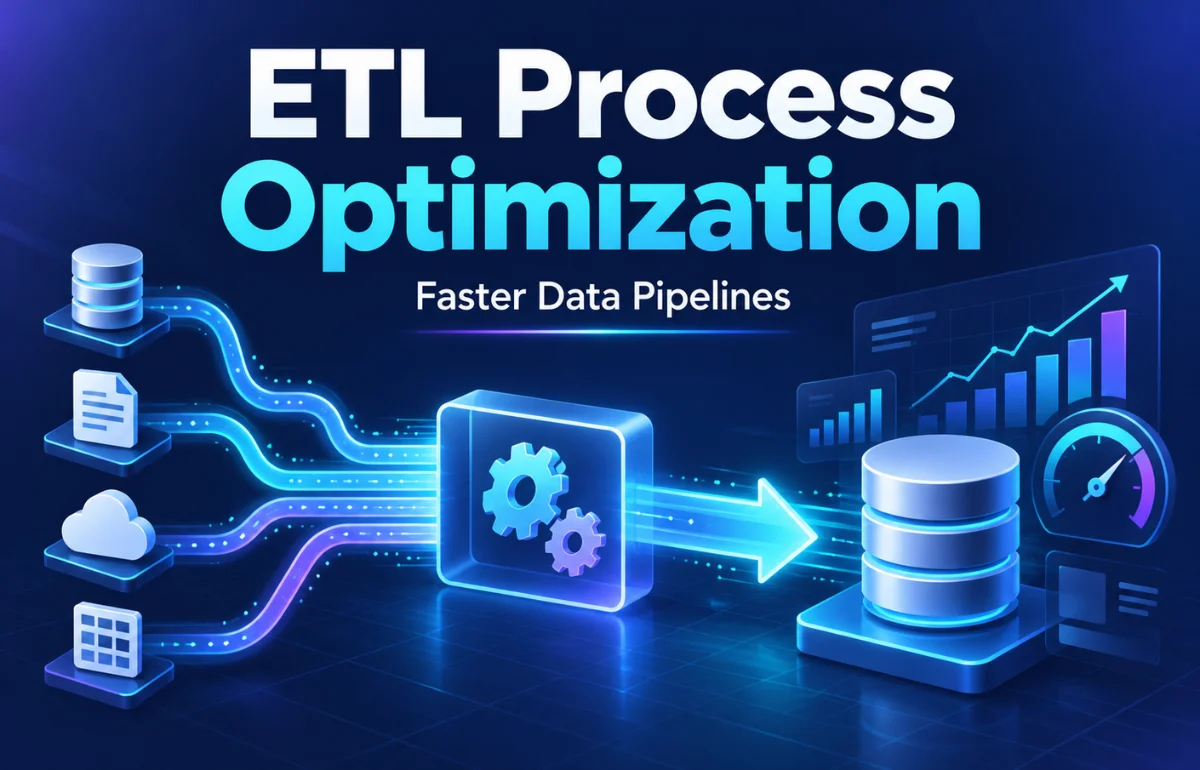
ETL process optimization is the practice of improving how data is extracted from source systems, transformed into a usable format, and loaded into its destination. The goal is to move accurate data with less delay, fewer failures, and more efficient use of computing resources. That might mean fetching only changed records, rewriting an expensive SQL query, or loading files in batches instead of inserting one row at a time.
I think the most useful starting point is simple: don’t optimize a pipeline just because it feels slow. Find where time, money, or data quality is being lost. A five-minute extraction problem needs a different fix from a five-minute warehouse query.
The methods below show how to tell the difference and make changes without putting trustworthy data at risk.
Why ETL Pipelines Become Slow
Data pipelines usually grow gradually. A daily job that once handled 50,000 orders may eventually process millions. New source tables appear, transformation rules multiply, and downstream teams expect fresher reports.
Meanwhile, the original loading strategy stays the same.
Slowdowns typically come from one or more of five places: excessive data extraction, inefficient transformations, small repetitive writes, resource contention, and time spent waiting between tasks.
Reliability problems can add a sixth: a failed job may restart from the beginning and repeat hours of work.
I separate two measures that often get mixed up. Processing latency is how long the pipeline takes to run. Data freshness is how old the newest available information is.
A job can finish in three minutes yet deliver information that is an hour old if it runs only hourly. Improving one clock does not automatically improve the other.
Measure the Pipeline Before Changing It
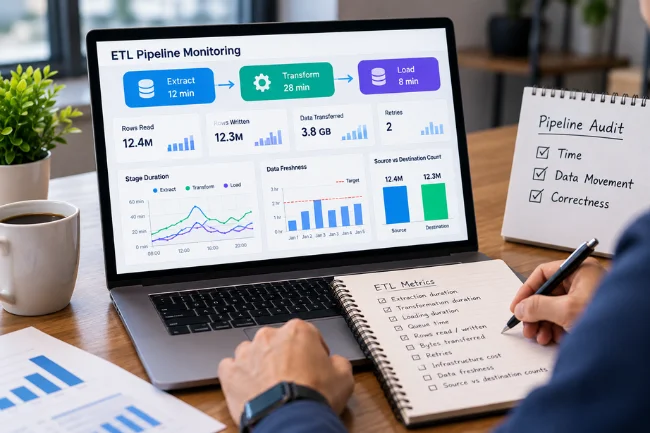
Start by recording stage-level measurements for several normal runs and at least one busy period. A single successful run hides peak-hour contention, intermittent API throttling, and end-of-month volume spikes.
Track extraction duration, transformation duration, loading duration, and time spent queued. Add rows read, rows written, bytes transferred, retries, and infrastructure cost per run.
For data reliability, compare source and destination counts and record how late each dataset arrives relative to its freshness target.
I like a simple three-ledger audit: time, data movement, and correctness. Time shows where a job waits. Data movement reveals unnecessary scans and transfers. Correctness confirms that speed improvements are not silently dropping or duplicating records.
A Quick ETL Bottleneck Checklist
| Symptom | What to inspect first | Possible improvement |
|---|---|---|
| Extraction takes too long | Full-table scans, API pagination, rate limits | Incremental reads or change data capture |
| Transformation dominates runtime | Query plans, joins, memory spills, repeated logic | Filter earlier and simplify set-based operations |
| Loading is slow | Tiny inserts, file counts, transaction overhead | Bulk loading and sensible batch sizes |
| Workers sit idle | Task dependencies and queue time | Better orchestration and selective parallelism |
| Jobs rerun frequently | Error logs, checkpoints, duplicate handling | Idempotent writes and restartable stages |
Measure the same workload before and after each change. Otherwise, a quieter source database or smaller daily batch can look like a performance win that never actually happened.
Optimize Extraction by Moving Less Data
For many ETL workloads, the cheapest record to process is the one you do not need to read again.
A full refresh may be reasonable for a tiny reference table, but it becomes costly when a large orders table changes by only a small percentage each day.
Use Incremental Extraction Carefully
Incremental loading reads records added or updated since the previous successful run. A common implementation uses an updated_at timestamp and a stored high-water mark.
For reliable paging, a timestamp alone may not be enough: multiple rows can share the same value, so a stable secondary key or overlapping extraction window may be needed.
For example, an extraction filter could use updated_at >= :window_start AND updated_at < :window_end. The job can then use a database MERGE or UPSERT to replace matching destination rows.
The overlap helps with timing uncertainty; the merge prevents repeated rows from creating duplicates. Advance the saved watermark only after the destination write succeeds.
Timestamps have limits. Hard deletes, backdated changes, and applications that fail to update modification times may escape detection.
In those situations, change data capture (CDC) can be a better fit. CDC tools such as Debezium read supported database change streams, including inserts, updates, and deletes.
They still require careful setup for snapshots, retention, and recovery.
Reduce API and Network Overhead
Request only required fields, use server-side filters when available, respect rate limits, and compress large transfers where supported.
For APIs, plan for pagination that remains consistent while source data changes. Avoid firing unlimited parallel requests at a system that serves live customers.
A useful boundary is to treat source-system health as part of the performance target. Cutting an ETL run by two minutes is not a success if it slows the production application for everyone else.
Make Transformations Do Less Work
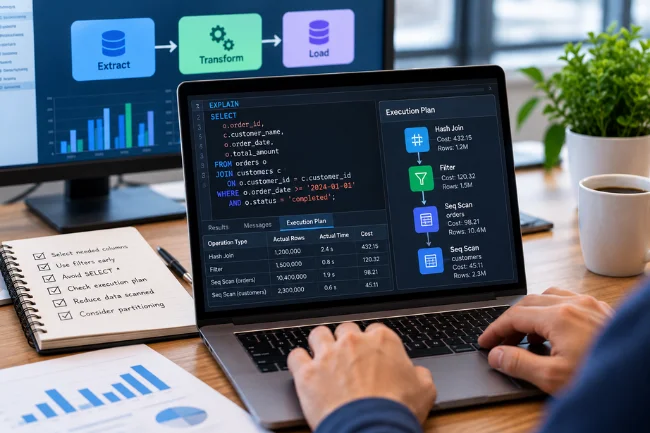
Transformations often become expensive because they repeatedly scan the same data or perform simple calculations one record at a time.
I would inspect the query plan before adding more compute. It may reveal a large join, missing filter, or sort spilling to disk.
Prefer set-based SQL operations over row-by-row loops where the database can perform the work efficiently.
Select only needed columns, remove duplicate transformations, and push filters closer to the source of each query.
Use EXPLAIN or the platform’s execution-plan view to verify the change rather than assuming shorter SQL means faster SQL.
For analytical warehouses, also examine data layout.
Google’s BigQuery guidance recommends avoiding unnecessary SELECT * queries and using partition filters to reduce processed data.
An ETL model that routinely scans years of events to update yesterday’s dashboard is a good candidate for incremental processing.
Know When to Transform Before or After Loading
Traditional ETL transforms data before writing it to the target. ELT loads the data first and uses the destination’s compute to transform it.
Neither architecture is automatically faster: moving raw sensitive data, paying for warehouse compute, or processing a small operational feed may change the answer.
| Approach | Usually helpful when | Main trade-off |
|---|---|---|
| ETL | Data must be cleaned or masked before entering the destination | Separate transformation infrastructure |
| ELT | A capable warehouse can transform large datasets efficiently | Warehouse cost and governance of raw data |
| Hybrid | Some fields need early protection while analytics runs later | More boundaries to monitor and maintain |
If confidential fields must never reach a particular destination, enforce that requirement before loading, regardless of which acronym appears in the architecture diagram.
Improve Loading With Bulk Writes and Smarter Files
Writing one row per request creates needless network and transaction overhead.
Where the target supports it, batch records and use native bulk-loading commands.
The PostgreSQL documentation, for example, recommends COPY for large imports because it avoids much of the overhead of repeated INSERT statements.
For cloud warehouses, file sizing matters. Hundreds of tiny files create scheduling and metadata overhead, while a single enormous file may limit parallel loading.
Snowflake’s documentation suggests roughly 100–250 MB compressed files, or larger, as a general bulk-loading target, with adjustments for freshness needs and the chosen loading service.
Do not treat a published file-size recommendation as a universal setting.
Test several batch sizes against your destination and monitor throughput, memory, locks, and failure recovery. The fastest huge batch may be the hardest to replay after a partial failure.
Partition large destination tables according to common filtering patterns, not simply because partitioning sounds advanced.
Too many tiny partitions can add overhead. Indexes also involve trade-offs: they help many reads but can slow frequent writes. Validate index or clustering changes against both load and query performance.
Use Parallel Processing Without Overloading the System

Parallel workers can shorten a run when tasks are independent and enough CPU, memory, bandwidth, and database connections are available.
They cannot make a single source server handle unlimited requests, and they will not fix a query that locks the same table for every worker.
Partition work by stable ranges, dates, or keys. Keep each chunk identifiable so a failed worker can replay only its own portion.
Start with modest concurrency, then increase it while watching throughput and source-side response times. Stop when added workers produce little extra output or create more failures.
I also check the pipeline’s critical path.
If extraction takes twelve minutes and loading takes one minute, doubling loading speed changes the overall run by only thirty seconds.
Optimizing the longest constrained stage is usually more valuable than tuning the most visible one.
Design for Retries, Data Quality, and Recovery
An optimized pipeline must remain correct when something goes wrong.
A network timeout can occur after a destination accepted the data but before the ETL job received confirmation. Blindly retrying an append operation may duplicate records.
Use idempotent writes wherever possible. A deterministic job should produce the same final result if its task runs twice with the same inputs.
Choose stable record keys, use UPSERT or MERGE appropriately, and keep checkpoints outside temporary worker memory.
Apache Airflow’s best practices specifically encourage transaction-like tasks and repeatable outputs on retry.
Validate each stage with a small set of meaningful checks: unexpected nulls, missing primary keys, duplicate business keys, schema changes, unusual row-count drops, and source-to-target reconciliation.
Capture rejected records in a reviewable location rather than silently discarding them.
Create a Replay Contract
Before I would approve a major optimization, I would ask four questions: What exact input interval did this run process? What happens if it runs again? How are deletions represented? How do we prove all expected records arrived?
That is a practical replay contract.
It turns recovery from guesswork into a defined operation. Documenting it is particularly useful when switching from a nightly full refresh to an incremental pipeline.
Schedule and Monitor for Actual Freshness
An orchestrator such as Airflow, Dagster, or Prefect manages dependencies, retries, and execution schedules.
But scheduling jobs every five minutes does not guarantee five-minute freshness. A job that queues for seven minutes has already missed that target before it starts.
Record both job duration and end-to-end data age. Alert on missed freshness objectives, failure spikes, growing queues, and unusual cost increases.
I prefer alerts linked to a user-visible consequence, such as delayed order reporting, over a flood of warnings about harmless short-lived CPU spikes.
Use logs to identify failed records, metrics to see trends, and traces or execution plans to investigate individual slow tasks.
Review peak-hour runs separately from overnight runs so averages do not hide the moments that matter to users.
Cut ETL Costs Without Sacrificing Reliability
Cost optimization is not simply choosing the smallest server.
A cheap machine that runs for six hours may cost more overall than a larger one finishing quickly, especially when other jobs wait behind it.
Compare compute cost per successful run, bytes scanned, storage and transfer charges, and the engineering time spent on failures.
Where available, use auto-suspend for idle warehouses, incremental models for repeated transformations, and retention policies for temporary staging data.
Keep enough capacity for backfills and recovery.
One decision I find useful is to measure cost per valid million records, not merely cost per million records processed.
Failed and duplicated rows still consume resources. This metric discourages shortcuts that look cheap until data has to be repaired.
A Practical Example: A Slow Orders Pipeline
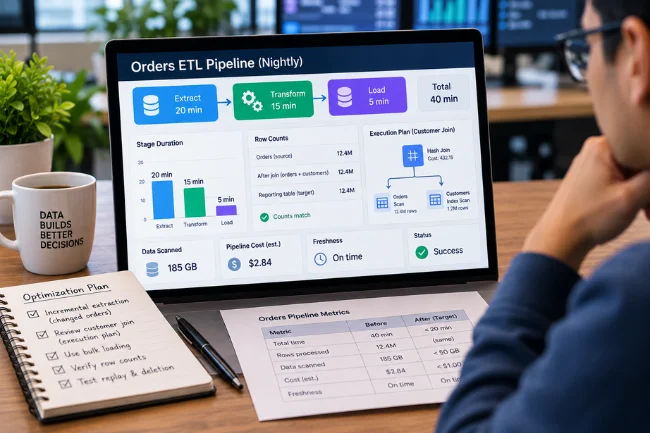
Consider an illustrative nightly pipeline that copies a large orders table, joins it with customer data, and rebuilds a reporting table.
It runs for forty minutes and must finish before morning reports. These figures are a planning scenario, not results from a benchmark I conducted.
First, separate its time into extraction, transformations, loading, and waiting.
Suppose extraction takes twenty minutes, transformations fifteen, and loading five. Changing file format alone will not address most of the delay.
I would test an incremental extraction that reads changed orders rather than every historical order.
Next, I would inspect the customer join’s execution plan and check whether an indexed or prefiltered lookup reduces unnecessary work.
Finally, I would switch repeated small inserts to a tested bulk-loading pattern.
After every change, I would compare identical input intervals and record row counts, elapsed time, bytes scanned, cost, and freshness.
I would also test a replay and a deletion event. Only then would I consider the job improved.
A faster run with missing canceled orders is not an optimization.
Common ETL Optimization Mistakes
The most damaging mistake is tuning without a baseline.
Others include increasing concurrency before checking source limits, assuming every full refresh needs replacing, dropping indexes without considering read traffic, and trusting record counts as a complete data-quality test.
Another overlooked problem is optimizing averages while ignoring tail latency.
If nineteen runs finish quickly but one frequently delays a financial report, the slowest recurring scenarios deserve attention.
Track a high percentile of runtimes alongside the average, plus the number of freshness breaches.
Do not buy a new orchestration platform to solve a poorly written SQL statement.
Likewise, do not rewrite the entire pipeline when a safe filter or bulk-load option may remove the real bottleneck.
Small, measurable changes are easier to explain, test, and reverse.
FAQs About ETL Process Optimization
What are the main techniques for ETL process optimization?
Incremental extraction, efficient SQL, bulk loading, partitioning, selective parallelism, and reliable retries address common bottlenecks. The right choice depends on measured stage performance.
How do I find a bottleneck in an ETL pipeline?
Measure extraction, transformation, loading, and queue time separately. Compare slow runs with normal runs, then inspect logs, query plans, and resource usage.
Is ETL faster than ELT?
Not inherently. ETL can reduce what reaches the target, while ELT can exploit warehouse compute; data volume, security needs, and pricing determine the better fit.
What is incremental loading in ETL?
It transfers records changed since a previous successful run instead of reprocessing everything. Watermarks or change data capture help identify those changes.
How often should I optimize ETL pipelines?
Review performance and freshness metrics regularly, especially after volume, schema, workload, or service-level changes. Investigate significant regressions rather than tuning on a fixed calendar alone.
Final Thoughts
ETL process optimization works best as a measurement habit, not a one-time speed project.
I would start with the slowest reliable stage, choose one reversible improvement, and verify its effect on time, cost, freshness, and correctness.
If you manage a pipeline today, collect timing and row-count data from its next few runs. That evidence will tell you where your first meaningful improvement belongs.

Noah Sterling is a technology research writer with 8+ years of experience covering emerging technologies, software trends, digital tools, and innovation. He creates practical, research-based articles to help readers understand the evolving technology landscape.